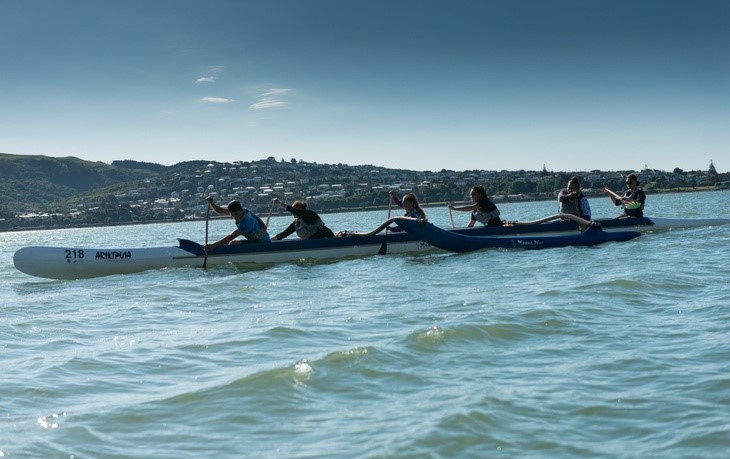
Sport and recreation injury statistics
Find statistics on injury claims for injuries that happened while playing sport.
Year to date data: 1 January 2025 to 30 June 2025
- 2025 ytd injury costs
- 2025 ytd new and active claims
- Sports claims and costs by year from 2016 to 2025 ytd
- New sport injury claims by common team sports and individual sports for the years 2023, 2024 and 2025 ytd
- Regional breakdown of sports claims
- Caveats to this data
2025 ytd injury cost
$512,989,105
The costs of all active claims in 20245 ytd
New claims
258,603
in 2025 ytd
Active claims
347,634
in 2025 ytd
Sports claims and costs by year
| Year | New claims | Active claims | Cost of active claims |
| 2016 | 501,702 | 569,354 | $544,776,828 |
| 2017 | 486,317 | 556,555 | $571,957,548 |
| 2018 | 468,662 | 547,209 | $612,890,155 |
| 2019 | 455,382 | 537,427 | $621,455,028 |
| 2020 | 402,806 | 486,278 | $633,379,298 |
| 2021 | 418,174 | 507,545 | $694,657,975 |
| 2022 | 421,622 | 502,066 | $731,849,927 |
| 2023 | 452,800 | 539,966 | $839,154,732 |
| 2024 | 487,146 | 585,117 | $1,007,738,201 |
| 2025 ytd | 258,603 | 347,634 | $512,989,105 |
Regional breakdown of sports claims
Did you know – Canterbury has the second-highest number of claims relating to rugby?
More information
Find out about the work we're involved in to prevent injuries while playing sport:
- A calendar year is 1 January to 31 December.
- 'New' claims are counted in the calendar year they were lodged.
- 'Active' claims have had a payment made on them during that year. Active claims may have been lodged in a different calendar year and can be counted across multiple years.
- 'Costs' don't include payments made for acute treatment in public hospitals.
- A client's age may differ between lodgement date and accident date.
- 'Region' is based on where the accident happened.
- The data was extracted at a point in time and may change if re-run later.
