How to apply for a grant
Find out about the types of projects we fund, who can apply, and how it works.
On this page
Types of projects we'll fund
We're looking for proposals that aim to lower injuries in the manufacturing sector, and that fall into one or both of the following categories. Please note, this is not available for existing health and safety solutions or products.
Innovation
These projects will focus on developing, implementing, and evaluating original and practical solutions for specific workplace health and safety challenges. These will apply innovation across the health and safety system by using technology, new systems, and methodology.
For example, developing engineering equipment to eliminate or reduce the risk of vehicle collision (eg forklifts) or machine related injuries (eg crushing) for workers in the manufacturing industry.
System capability development
These projects will focus on solving problems of national significance. They'll design, test, develop, and share solutions that build the workplace health and safety capability of New Zealand as a system.
For example, designing an industry-wide competency framework to ensure adequate workers’ safety risk management.
Projects must be aligned with the investment priority for this funding round. You can find more details about grant round five on our workplace injury prevention grants page.
Who can apply
To apply for a grant, organisations need to operate in New Zealand and be a registered legal entity, eg:
- a business
- charity
- university
- union.
Applicants can also be a collective of organisations collaborating on solving a problem. Grants are not open to individuals.
Amount of funding available
Applicants can apply for between $50,000 and $500,000, excluding GST, per year for a maximum of three years.
The amount of funding will depend on the scope of your proposal and the health and safety benefits it aims to create. You’ll need to co-fund at least 20% of the requested grant amount. Applications which best meet our assessment criteria will be considered for a grant.
The application process
For a detailed explanation of the application process please refer to the applicant guidelines and support section.
The application process for the WIP Grants consists of two stages – an Expression of Interest (EOI) Stage and a Full Application Stage.
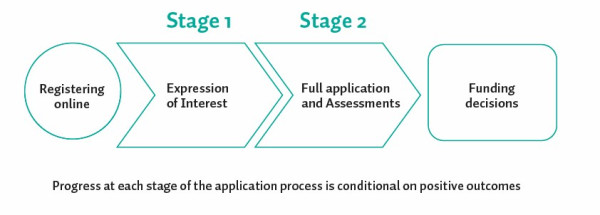
Stage one - Expression of Interest - now closed.
Stage two - Full application and assessments
1. Full application submission
Develop a comprehensive grant proposal, addressing all the required components such as project details, budget, timeline, and expected outcomes. See the applicant guidelines and support section for more detailed information.
Submit your completed grant application within the specified time frame.
2. Full application assessment
- Submitted applications are checked for completeness.
- A group of assessors will review all submitted full grant applications and evaluate them based on their quality, feasibility, and alignment with the grant's objectives.
- A moderation team reviews the scored applications and recommends applications for funding/contract discussions.
Key dates
The key dates* for the March 2024 funding round of Workplace Injury Prevention Grants are as follows:
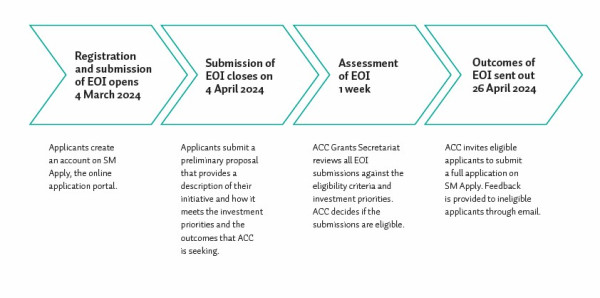
- 4 March 2024, 9am - Registration and submissions now closed for Expressions of Interest (EOI)
- 4 April 2024, 5pm - Submissions for EOI applications close
- 26 April 2024 - Outcomes of EOI and invitation to submit full application sent
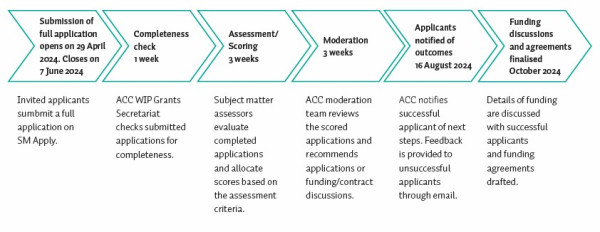
- 29 April 2024, 9am - Submission of full application opens
- 7 June 2024 - Deadline to submit full application
- 16 August 2024 - Applicants notified of results
- October 2024 - Recipient announcements
*These may be subject to change.
Applicant guidelines and support
When funding rounds open, we run a series of webinars to cover key themes and support you through the application process. You can find the supporting information for the March 2024 applications below.
Workplace injury prevention grants applicant guidelines
Note: These guidelines are subject to potential changes prior to the application go-live date of 4 March 2024. Please ensure you review the guidelines prior to submission of your application.
Webinars:
Introduction to Workplace Injury Prevention Grants, investment priority and EOI
Preparing a full application
Download the webinar Q&A document
The standard funding agreement terms and conditions includes important information such as ownership of intellectual property and confidentiality.
Q&A document
Contact us
Send us an email if you have any questions about the Workplace Injury Prevention Grants. We’ll get back to you as soon as we can.